
Lessons learned for performance engineering in hybrid cloud (Azure, AWS, Google …)
Lessons learned for performance engineering in hybrid cloud (Azure, AWS, Google …)
Optimizing the performance of the Dynatrace platform on the “new clouds”
In one of my latest PurePerformance podcast episodes, we went back to the roots of our podcast and talked about performance engineering with Klaus Kierer, Senior Software Engineer in the Cluster Performance Engineering Team at Dynatrace.
Klaus is working in the team that ensures that our Dynatrace SaaS offering runs in an optimized and efficient way and is scalable. Dynatrace recently announced that we expanded our SaaS offering from hosting on AWS (running on EC2) to now also run on Kubernetes hosted in Azure (AKS) or Google Cloud (GKE). In his role, Klaus helped optimize the performance of the Dynatrace platform in the “new clouds” before we officially launched that offering.
The process of moving workload to k8s and into other clouds taught Klaus a lot about dealing with performance and scalability issues in those new environments. Here are some of the lessons he learned that he shared with us on the episode. (If you’d like to listen to the full episode, check it out here: Performance Engineering for Hybrid Cloud Replatforming)
Removing the Azure Load Balancer to solve performance issues
Once the team moved Dynatrace to Kubernetes (k8s) and on to Azure (AKS), Klaus was tasked with validating the performance and reliability of all components (cluster nodes, Active Gates, Cassandra, Elastic …). To do that, he ran load tests using the so called “cluster workload simulator”. It’s a load generator that the team built years ago to simulate traffic that normally gets generated by Dynatrace’s OneAgent as it observes full stack performance of the systems it is deployed to.
To start off, Klaus simulated load equivalent of 5000 monitored hosts and 25000 actively monitored processes and services. As Dynatrace on AWS was the current benchmark, he started simulating the same workload pattern against the Azure deployment to compare whether it behaved differently.
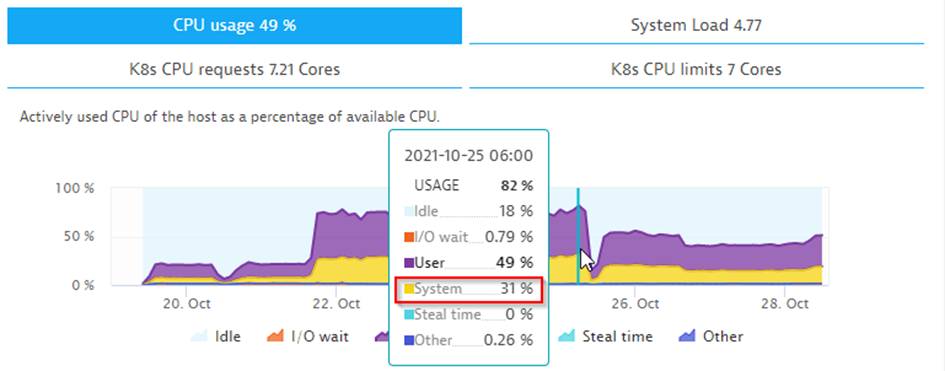
Initially, the performance looked good, but as soon as load increased, he saw that the ingress node and the co-located Active Gate had atypical rates of CPU usage.
Now, to give you some background: Data sent from OneAgents, or in this case generated by the load generator, must be ingested into Dynatrace that runs on AKS. In AKS, data can be ingested in different ways: via application gateway (OSI Level 7) or the app load balancer (OSI Level 4). The initial deployment used application gateway which resulted in rather high CPU usage on the ingress nodes where NGINX was running
After some investigation and a tip from a colleague in our lab in Gdansk, the cluster performance team realized that the application gateway might be the issue and replaced it with the load balancer. This change lowered CPU usage significantly to a workable level — freeing up CPU for the Dynatrace backend services.
Klaus learned a lot about this topic thanks to this great blog post. If you are moving workloads to k8s, then here’s what you need to know in a nutshell:
Different types of load balancers provide different capabilities on different layers in the OSI stack. The higher in the stack the more work is necessary to analyze the content in those data packages, e.g., analyzing HTTP vs TCP/IP payload for routing rules. In the case of Dynatrace the analysis on the ingress controller at http level was unnecessary. It was more important to get those packages as fast as possible to the Dynatrace cluster. The higher the load the more important this becomes.
Disk performance is different between cloud providers
Turns out that there is quite some difference between cloud providers on which disks you can use and how much they cost. Klaus’ team had a lot of experience with AWS, their disk offerings, and the performance for both read and write access. Years ago, when testing Dynatrace Managed on Azure, they already identified different disk performance behavior. Premium SSD disks on Azure had, for instance, quite a different latency profile than what they were experiencing on AWS.
What Klaus additionally discovered is that Azure Disks are highly optimized for parallelism, leading to issues with the Dynatrace server where writing to session storage became a performance challenge.
Another finding was that on Azure, read disk caching is only supported for up to 4 terabytes. One gigabyte more and you cannot enable caching. This has a tremendous effect on Elastic if you want to read logs for on-demand and ad-hoc analysis.
Cassandra, another critical component in Dynatrace, has high performance requirements on reading data from disk as well. To make Cassandra as efficient to run on AKS like it does on AWS, they had to make several changes to ensure both read and write performance.
Overall, testing across all three cloud vendors showed that they all offer similar throughput and latencies. However, with Azure you’d need to use Ultra Disks to match the performance results of Google or AWS. Eventually, the team decided to go for Azure Premium Disks instead of Ultra Disks as they could optimize the software configuration to achieve the desired performance with that storage offering.
Especially in high volume workload environments like we see at Dynatrace, those results show that it takes optimization effort for each cloud to get optimal performance and efficiency. While “in theory” you can easily move your workloads from one cloud to another, in practice it means that you either must live with the tradeoffs or have to invest the time to optimize your system for a specific target cloud. Now — this shouldn’t be a surprise as every cloud vendor uses different hardware configuration. The good news, though, is that things can be tweaked to achieve the desired outcome.
Question the default values set on containers
Another great finding was around container performance. Be aware of which container images you use if you don’t build them yourself. You might run into issues because pre-built container images may have settings that aren’t production-like because it’s easier to get started with them.
As an example: With Elastic Klaus’ team had an issue with memory mapped files. The feature was disabled by default to allow running containers without privileged mode. That caused high system CPU usage with Elastic and resulted in indexing that took longer than 2 minutes. It was like driving a Porsche with the handbrake on. As soon as they switched the flag to use memory map files, indexing times were lower than 10 seconds (90% improvement).
Also, the pre-built container was using a version of Java that was outdated and not officially supported by Dynatrace. As the team uses Dynatrace to monitor Dynatrace, they would have missed that visibility. The Dynatrace OneAgent colleagues helped us gain that visibility by pointing us to flags allowing to enable monitoring of outdated technologies.
Kernel tuning
In multi-cloud environments, it’s quite hard to find one single solution for kernel tuning since each provider has different options. You can use scripts directly on the node, or daemon sets to enable kernel tuning, or use init containers. But that always depends on the software you are running.
Cassandra, for instance, requires you to set some parameters to get the performance you want. In most cases you need kernel tuning to enable memory mapped files to really use the memory for caching. If you don’t raise the default values for Cassandra, you will sooner or later run into memory problems and out of memory errors. And because of that, pods get restarted by k8s leading to all sorts of other problems.
For Cassandra they use cassKop as an operator and for that they cannot use init containers. On GCP they had to use our own daemonset to enable kernel tuning parameters. On Azure on the other hand, they just set them through their Terraform scripts straight on the k8s nodes.
To sum it up: A prebuilt container image is a great starting point. You get things started fast but you have potential risks.
Tip: Building your own container images on a well-maintained base image increases flexibility.
Garbage collection settings
A dynamic runtime favorite topic is GC (Garbage Collection). GC settings can cause quite some troubles in production when you don’t load test the behavior up front.
Klaus’ team ran into issues with the Dynatrace ActiveGate using CMS garbage collection. Depending on how much CPU you assign to the container, you get different amounts of memory utilized by the JVM for the different heap regions. During the load test, the ActiveGate couldn’t cope with traffic as soon as load increased. After some research, they realized that the issue was because the Eden space is calculated based on how much CPU is available for the container. Once you adapt the GC settings or change the CPU-limits, these issues disappear.
Performance engineering isn’t dead with the cloud
The last big lesson learned from our conversation is that “performance engineering isn’t dead with the cloud”, as my co-host Brian puts it.
You can do many things out-of-the-box with standard containers and cloud providers, but that doesn’t mean that everything will run optimally and perform as you want it. The good thing is that if you do it yourself, you have the control, but you need to also have the expertise to know what to look at to optimize.
Listen to the full podcast episode to learn even more tips on performance engineering for hybrid cloud with Klaus Kierer. Find it here on Spreaker: https://www.spreaker.com/user/pureperformance/performance-engineering-for-hybrid-cloud
Thank you again, Klaus, for joining us on this episode!
Lessons learned for performance engineering in hybrid cloud (Azure, AWS, Google …) was originally published in Dynatrace Engineering on Medium, where people are continuing the conversation by highlighting and responding to this story.