
Instrumenting Keptn with OpenTelemetry
Why and how Keptn is adopting OpenTelemetry Distributed Tracing at its core.

The complexity surrounding building and shipping distributed systems is probably of no surprise to anyone these days. Apart from building your applications, you also need to understand and work with things such as container orchestration, service meshes, public/private/hybrid clouds, distributed databases, infrastructure as code, and much more.
As they say, a picture is worth a thousand words. The CNCF Cloud Native Landscape is a good resource to get familiar with all the projects and initiatives that are commonly used when building distributed, cloud-native applications.
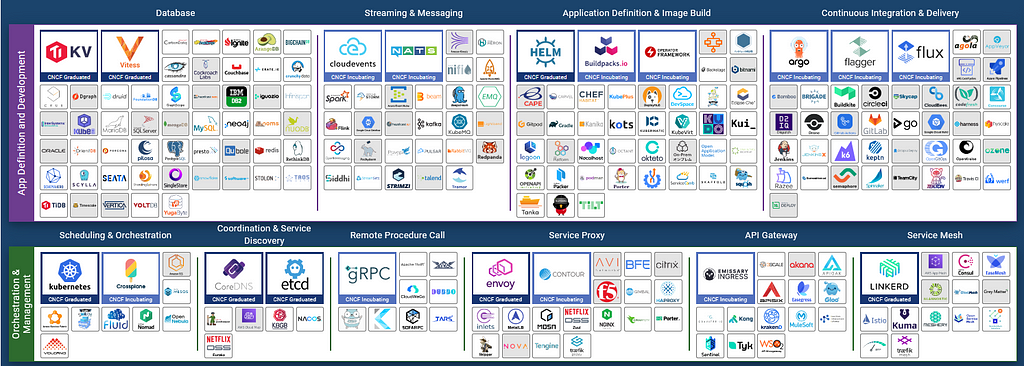
Several of these CNCF projects are now gaining momentum and trying to help users make sense of this complexity. Keptn and OpenTelemetry are part of this group of projects, adopted by multiple companies and boasting hundreds of contributors worldwide.
OpenTelemetry is an important topic for us at the Open Source Engineering team at Dynatrace. As a collaborative effort between our team and the Keptn team, we’ve been making progress towards instrumenting Keptn’s core components with OpenTelemetry. In this post I’d like to share with you why and how this is happening.
The Keptn docs and the OpenTelemetry docs are good places to start if this is the first time you’ve ever heard about them.
What you will learn about in this article
- Why is Distributed Tracing important for Keptn?
- Demo: A trace produced by the Quality Gates feature in Keptn
- Pitfalls encountered while instrumenting Keptn with OpenTelemetry
- Closing and next steps
Why is Distributed Tracing important for Keptn?
One way to tackle the increasing complexity of distributed systems is by leveraging Distributed Tracing. OpenTelemetry defines it as follows:
Distributed tracing: Tracks the progression of a single Request, called a Trace, as it is handled by Services that make up an Application. A Distributed Trace transverses process, network and security boundaries.
Learn more about Distributed Tracing in this great article: What is distributed tracing and why does it matter?
Keptn is a cloud-native application composed of multiple microservices that interact with each other via events (CloudEvents to be more specific, another CNCF project).
As you’d expect, Keptn faces the same challenges as any other cloud-native application. Any operation can fail or behave wrongly at any point — so the common benefits of Distributed Tracing apply here as well.
But we can expand further on the benefits of having built-in Distributed Tracing into Keptn for two different targets: Keptn adopters and contributors. Let’s see these in more detail next.
Distributed Tracing for Keptn adopters
Keptn helps adopters in all stages of their DevOps operations. From continuous delivery to testing to making sure their service-level objectives (SLOs) are maintained, right down to remediations when things don’t go as they should.
With such an important tool at their disposal, it’s critical for adopters to know how their Keptn installation is behaving. That’s when Distributed Tracing comes into play. By having it built-in into Keptn, adopters can be confident that their installation is running smoothly. In addition, they can rest assured knowing that in case something goes wrong, they have the information needed to troubleshoot and fix it.
Another advantage is that by instrumenting Keptn with an open standard like OpenTelemetry, adopters can simply configure it to send the tracing data to their existing platform/backend of choice. No vendor lock-in, no need to purchase and learn a new tool. This makes adopting Distributed Tracing frictionless and easy.
Distributed Tracing for Keptn contributors
Distributed Tracing is also of great value to Keptn’s developers and contributors in general because:
- It gives visibility to “hot paths” and slow operations — that can be later modified to improve performance and overall stability of Keptn.
- It helps troubleshooting issues reported by adopters — Since everyone speaks the same “language” (traces) it’s easier to investigate things together.
- By simply trying out Keptn and looking at the generated traces, new contributors can have a visual representation of how things work and how a triggered operation “flows” across the services. A great addition to static architectural diagrams that might not be updated frequently enough or only cover some parts of the application.
Now that we know traces are valuable for both Keptn adopters and contributors, let’s see a real example of a trace.
Demo: A trace produced by the Quality Gates feature in Keptn
As an initial proof of concept, we started by adding trace instrumentation to Keptn’s Quality Gates — a key feature for release/deployment validation using Keptn.
To validate the traces, we used the demo project with multi-stage pipeline + SLO-based quality gates from the Quick start.
Then, by simply triggering an evaluation via the Keptn CLI, this is what we have:
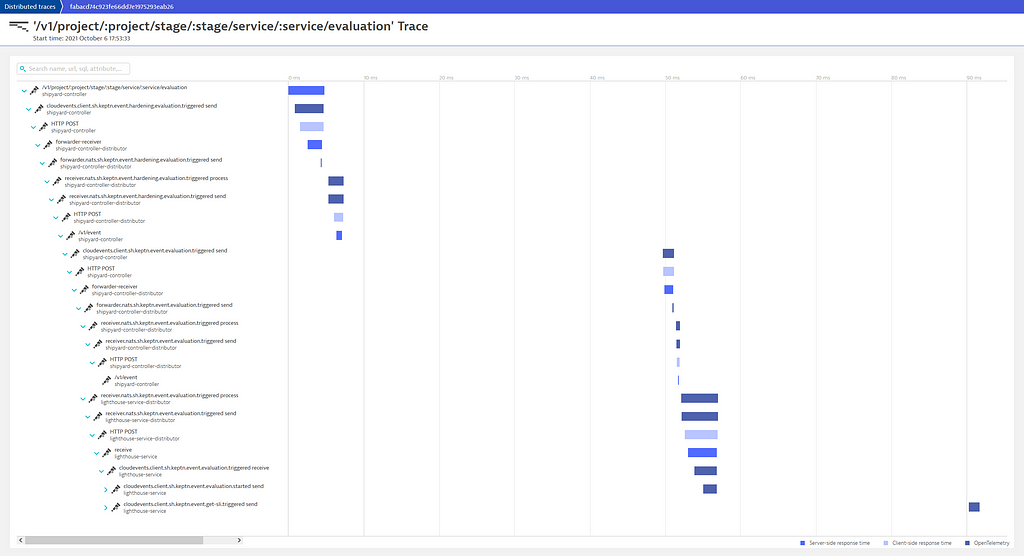
The trace above shows the “story” of what happens when a Quality Gate evaluation is triggered via the Keptn CLI. All starts with the sh.keptn.event.hardening.evaluation.triggered event sent from the Shipyard controller. This is then forwarded to NATS by the Shipyard’s distributor sidecar (shipyard-controller-distributor), which is then picked up by services that are interested in it. In this case, we can see the Lighthouse service reacted to the evaluation triggered event. It then sent two new events: sh.keptn.event.evaluation.started and sh.keptn.event.get-sli-triggered.
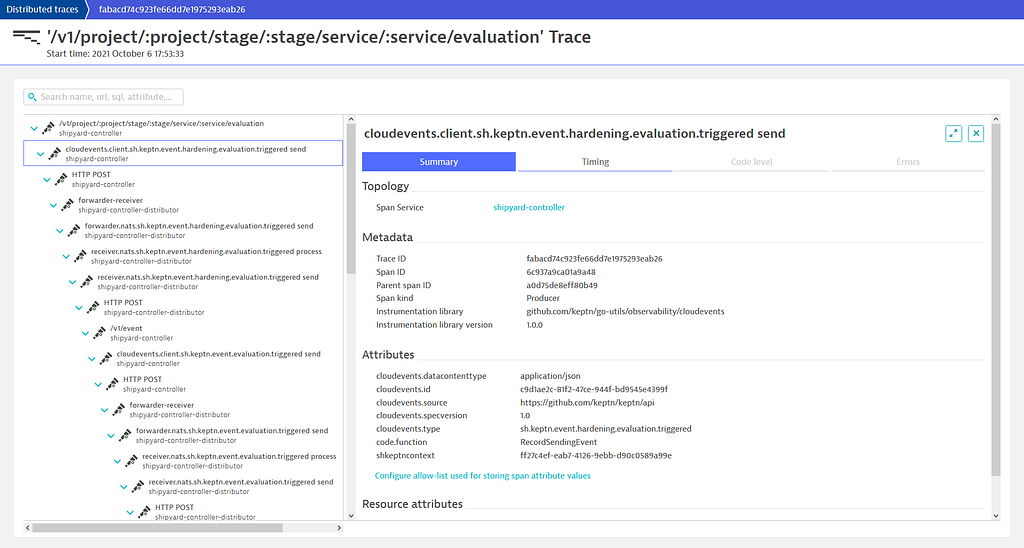
By selecting an individual operation (e.g. sending an event), we can see even more details:
How does it work?🤔
Keptn services configure the OpenTelemetry SDK to export the spans to an OpenTelemetry collector. In this example, we configured the collector to export directly to Dynatrace’s OTLP ingest endpoint. Because the collector is highly configurable, you can send the spans to multiple places by providing other exporters. You can check the OpenTelemetry Registry to see the available exporters.
Alright. Let’s dive a bit into the technical part and see how the actual instrumentation with OpenTelemetry looks like and some potential pitfalls you might encounter.
Pitfalls encountered while instrumenting Keptn with OpenTelemetry
OpenTelemetry offers SDKs for all major programming languages, including Go. While instrumenting Keptn with the Go SDK, we encountered some “pitfalls” and that’s what we’ll be looking at next.
But first, a word about context propagation.
Context propagation is key
As we have seen before, from the OpenTelemetry definition of Distributed Tracing:
A Distributed Trace transverses process, network and security boundaries.
So, you might be wondering: how exactly is a trace able to transverse process and network boundaries like that? This is possible because of a concept called context propagation. Context propagation is a mechanism where trace identifiers are sent across boundaries, such as via the network. By crossing such boundaries, a trace then becomes a Distributed Trace.
A practical example: in a simple HTTP client/server scenario, before sending the request to the server, the client injects the current context into the HTTP request as a header. Upon receiving the request, the server then extracts the context from the header and then continues the trace.
You might be asking next: But how does the server knows how to read this header and make sense of it? That’s when the W3C Trace Context standard comes to the rescue. OpenTelemetry leverages the W3C Trace Context standard, and by instrumenting both client and server, they will be able to “understand” each other due to this common standard. This is how two independent applications can be part of a distributed trace.
Context propagation in the OpenTelemetry Go SDK
The OpenTelemetry specification instructs that SDKs should use existing language constructs to express and propagate the context. By adopting well-known language constructs, the OpenTelemetry SDKs become easier to get started with since developers are already familiar with them.
It’s important to know how to use the context. The specification describes that its usage may be either implicit or explicit. But what does that mean exactly?
For example: C# is a language that uses implicit context. Web applications built with C# always have a context available implicitly (HttpContext). This means that developers don’t need to explicitly manage it. They don’t have to create it nor pass it down the chain of calls in their applications. The OpenTelemetry SDK for .NET takes advantage of that, so developers don’t need to do anything apart from configuring the SDK to get complete traces.
In Go things are different. As you may know, Go has an implementation of a context in its standard library (context.Context). The big difference is that Go is explicit about its usage. When writing Go applications, developers are responsible for using it. This means: Having to potentially create it and always pass it down the chain of calls. If they don’t do it, they will end up with what’s known as “broken traces”.
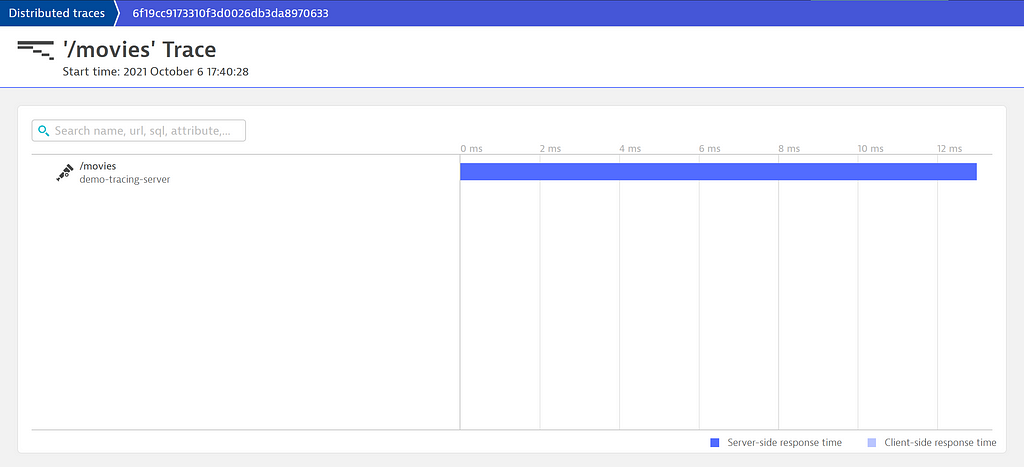
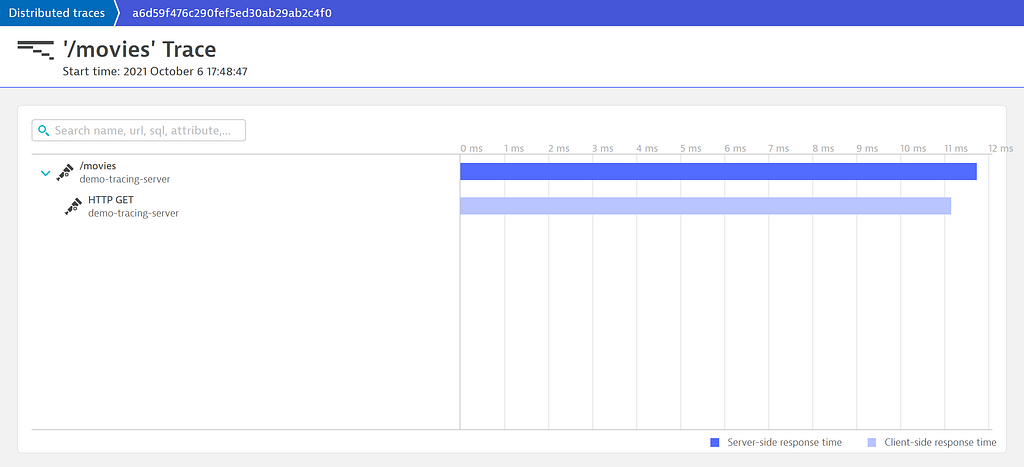
To demonstrate what a broken trace is, consider the following app/scenario:
- A REST API instrumented with OpenTelemetry
- The API exposes a ‘/movies’ endpoint which then makes an HTTP call to an external service
First, let’s look at the code that does not pass the context.Context explicitly:
Now let’s look at the code that does pass the context.Context explicitly:
The getMovies() function receives the context.Context parameter and uses it to create the HTTP request. With this modification, we now have the complete span, containing the second HTTP request:
While instrumenting Keptn, we encountered this very issue in multiple services.
There might be numerous reasons why you may encounter code that is not passing down the context.Context object.
The first reason may be due to an outdated codebase, since the context.Context type was only introduced in Go 1.7. Another reason may be that context.Context is commonly used for things like ‘cancellation’, and you didn’t need it in your application so you never added it to your functions/methods.
No matter the reason, the context.Context type in Go is what is used to propagate context in OpenTelemetry, and we’ll probably see its usage increase as OpenTelemetry adoption itself increases.
The problem with code that doesn’t request the context.Context parameter is that changing it can be difficult since it might introduce a breaking change to your public API (Go does not support method overloading). Fortunately, there are a couple of alternatives you can use to solve this.
In Keptn, we are adopting two solutions: Introduce new functions that accept the context.Context parameter and simply make the old call the new, passing context.Background(). The second solution is adding the context.Context as a property in a struct that the function already receives.
These approaches are described in the Go blog and you can read more about them here: Keeping Your Modules Compatible and Contexts and structs. Such alternatives were even used in Go’s own standard library.
Closing and next steps
That was a lot of information. Let’s recap what we’ve talked about in this post.
We started with a brief introduction around how building distributed, cloud-native applications can be overwhelming due to the number of technologies involved. Then, I introduced you to two CNCF projects that are here to help us tackle this complexity — Keptn and OpenTelemetry.
Next, we saw the benefits that Distributed Tracing can bring to both Keptn adopters and contributors. I also demonstrated how does a trace generated by triggering a Quality Gate evaluation in Keptn looks like in Dynatrace.
Then, we went into a more technical direction. We discussed briefly about Context — what it is, why it matters and how it is propagate across systems. I showed some pitfalls that can happen when adding instrumentation to your Go applications and how you can overcome them.
We are just scratching the surface, but the initial proof of concept showed that Distributed Tracing is of great help for Keptn.
The next steps will be around improving the context propagation within the codebase and starting to instrument other Keptn core components.
If you are interested in following the progress of this work, you can subscribe to this Keptn Enhancement Proposal. You can also reach out in Keptn’s slack workspace for questions and stay tuned for more posts about this instrumentation journey! 🚀
Note: The instrumentation demonstrated in this post is a work in progress and it’s not yet part of a Keptn release.
Instrumenting Keptn with OpenTelemetry was originally published in Dynatrace Engineering on Medium, where people are continuing the conversation by highlighting and responding to this story.