
Creating a JUnit extension for tracing tests with OpenTelemetry
Handling unit tests can be overwhelming just for their sheer quantity. Here’s how we came up with a new solution.

Unit tests sit at the very bottom of the testing pyramid, making them the foundation of all other tests needed to ensure bug-free software. Unsurprisingly, to avoid unpleasant surprises for our customers, we run millions of tests at Dynatrace, and a lot of them are JUnit tests.
When you are running so many tests, it’s natural to find some issues and bugs, and thankfully we have a very good automated system in our company that takes measures when this happens.
However, there were moments when our unit tests took a long time and we wanted to understand why to be able to improve them. In the setup we had, it would have been a lot of work to learn how the tests were parallelized, if one was taking longer than the rest, and so on. The data was there, but we needed OpenTelemetry to make sense of it.
So, we decided to create our own extension to simplify this process: the JUnit Jupiter OpenTelemetry Extension.
Before we explain how it works, let’s go over the basics.
What is JUnit?
As already mentioned before, unit tests focus on the smallest parts of the code: classes and methods. On average, thousands of unit tests run at the same time, and frameworks like JUnit make this possible.
JUnit is an open-source framework built specifically to test Java, which is our main developing language at Dynatrace.
What is OpenTelemetry?
OpenTelemetry is an open-source tool used for gathering telemetry data. This means logs, traces and even metrics. This data can easily be sent to different endpoints and used further or be displayed. As an example, one could start a span, which as the name suggests spans something, on the start of a method and end it at the end of it. Attributes, i.e., the operating system, can be added to it. All those spans then make up a trace.
Learn more about OpenTelemetry here.
How to set up the JUnit Jupiter OpenTelemetry Extension
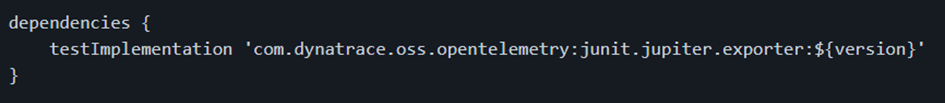
To get going with the extension, we need to add the dependency. In this example, we use Gradle for managing dependencies. (It’s also possible to use Maven, please see the instructions here on how to do it.)
Enter the following text to import what you need:
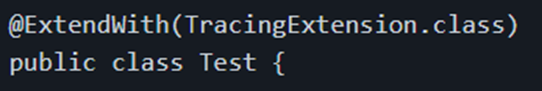
After this step, all we have to do is tell our tests to use the extension.
One way to do this is to add an annotation over our tests:
What’s the result?
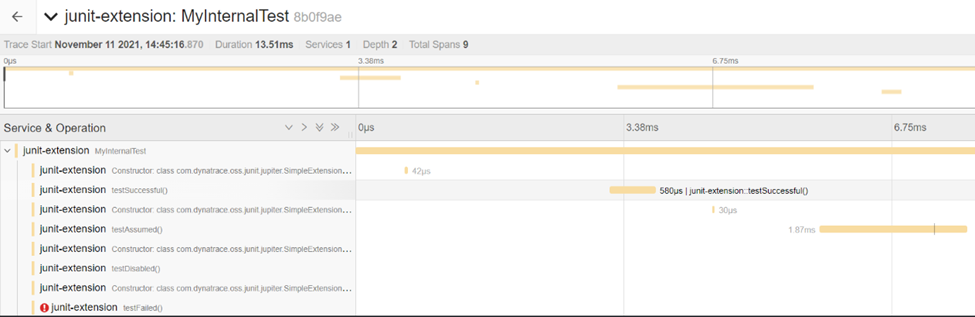
At this point, you might be wondering what all of this looks like.
To be able to see the tests in a UI, I set up a local Jaeger environment before running the tests. Here is what the result looks like:
You can also export it to many different endpoints, i.e., Dynatrace, Zipkin, or directly to an OpenTelemetry collector for further distribution.
With that, we can see that we have a test class called MyInternalTest. The tests are executed sequentially and that the last one failed.
The dashboard displays which JUnit tests are running and how long each of them takes. This is helpful to see at first glance which tests take up most of the time and quickly find out the root cause of any slowdowns.
Try it yourself!
The JUnit Jupiter Open Telemetry Extension is open source and free to use. You can try it out by downloading it from our GitHub repository.
Creating a JUnit extension for tracing tests with OpenTelemetry was originally published in Dynatrace Engineering on Medium, where people are continuing the conversation by highlighting and responding to this story.