
Correlating distributed traces of large scale systems
Execution traces are a useful tool to gain insight into whether software is performing and working correctly. However, even if most execution traces are lightweight, some can grow so big that they cause issues in the backend. At Dynatrace we have been working on ways to safeguard our architecture to deal with these huge execution traces.
For the past few years, I’ve been part of a team at Dynatrace that handles execution traces when they arrive from instrumented applications. In some cases, we had to deal with huge execution traces that time and time again challenged our architecture and beliefs of what can exist in real world applications.
It is commonly thought that execution traces only take a few milliseconds, or seconds at most, in response time and consist of only a few called services. However, at Dynatrace we also experienced execution traces that grew indefinitely until they became so big, that our backend came to a halt.
In this blog post I will share some of our experiences in dealing with these “huge” execution traces, how they came to be and how we hardened our architecture against them. But first, let’s discuss what execution traces are and how they are correlated.
Execution Traces
An execution trace shows all called services in their hierarchical execution order.
Let’s take as an example the call trace of a web service during the execution of a web request. It includes some or all of the methods called by all involved services (web services, databases, queues, etc.).
Here’s a typical example of an execution trace in Dynatrace:
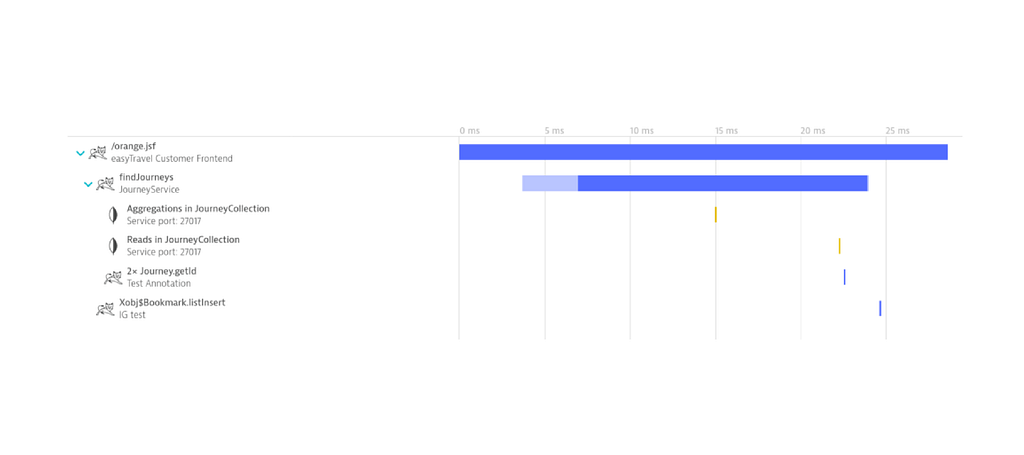 Execution trace PurePath
The endpoint method orange.jsf was called, which in turn calls JourneyService’s findLocations. Furthermore, we can see that a database was also called during the execution.
Recent efforts have begun to standardize execution traces in the form of OpenTelemetry. Which I’ll use as a basis for explanation in this blog post, as it is open source and has similarities with Dynatrace’s proprietary format.
OpenTelemetry allows developers to create spans for methods of interest and add custom metadata. Thanks to the standardization, a wide range of “backends” (i.e., applications which receive those execution traces, correlate and analyze them) are able to handle the same kind of data, thus allowing the developer to pick which backend he prefers.
From Spans to Traces
In OpenTelemetry, each transaction carries an id, the trace id, which helps to link parts of a transaction across several services. Each service emits a number of spans, which belong to a trace. Each span has its own unique span id, and to establish a link to its immediate parent it also carries the parent span id. Furthermore, each span carries also the trace id, to indicate to which transaction it belongs.
Thus, a trace is a tree of spans.
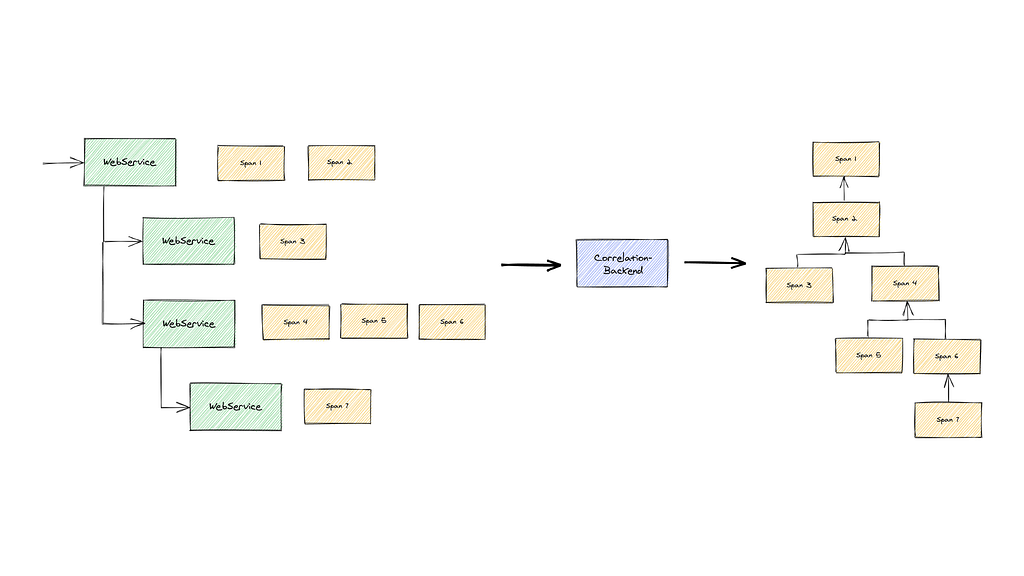 Correlation
Correlation
Spans arrive individually at the backend. From the individual spans, the trace is reconstructed via the parent span id and the trace id, and this is referred to as a correlation.
We can distinguish two forms of correlation:
correlation on write, i.e., a trace is kept in memory and updated with new spans belonging to the trace, and upon completion of the transaction, it is stored as a whole (as done in Apache Skywalking, Grafana Tempo);
correlation on read, i.e., the individual spans are stored “as is”, without generating the whole trace in memory beforehand. Upon querying, the trace needs to be correlated given the individual spans (as done in, e.g., CNCF Jaeger).
For “write” correlations, if there are many or big traces waiting to be finished, there is a lot of memory pressure. It is also necessary to know when a call has ended, but this, for example, is currently difficult with OpenTelemetry, as there is no indication of when a call has ended.
The advantage of correlation on write is that it can provide live-statistics as well as response time alerts for the whole trace.
For correlation on read, the ongoing memory pressure is less. However, the downside is that upon each read the trace needs to be correlated, as well as no alert on the response time for a transaction.
As we can see, for both options, the trace must at some point be constructed in memory. But what happens when one of these traces becomes big enough to cause problems?
“Too big” can come in two forms,
- Wide, e.g., where one parent method executes a lot of web requests, or
- Deep, e.g., where each method executes another method, which in turn executes another method, and so on.
In the next two sections, I will discuss, how and why trees can get too big, or even grow indefinitely. Afterwards, I will outline Dynatrace’ way of handling these traces.
Wide Trees
Wide trees are paths in which a process calls in succession other services, e.g., web services. An example would be a long running batch process that performs a maintenance task, where runtime exceeds several hours.
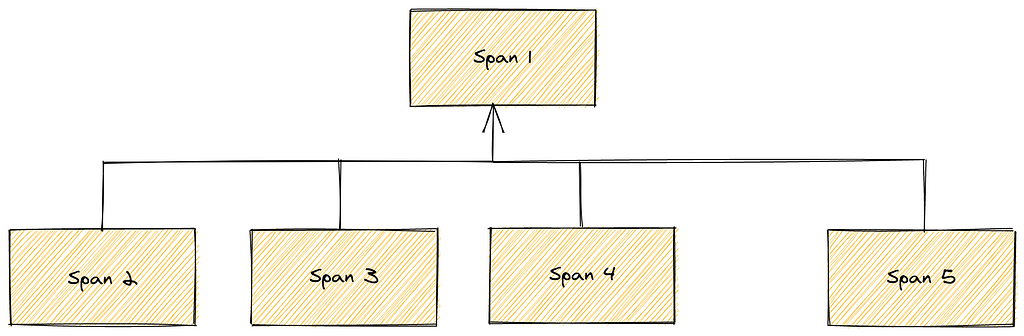 Wide execution trace
This is especially problematic for on write correlation, because as time goes on each trace consumes more memory. This gets even worse when multiple trees of this type have to be kept in memory and continuously updated. Assuming that such a maintenance task generates spans at a somewhat reasonable pace, eventually one of these will consume so much memory that the whole backend comes to a halt and no further process will be possible.
This is an example of correct but still somewhat unexpected behavior. But what happens if such a wide tree is caused by a bug, and on top of that, every few milliseconds a new span is added?
The following case shows this: a customer created a JMS queue onMessage-listener. In the implementation of onMessage an exception was thrown, but the customer did not add exception handling, so the message was propagated upwards to the JMS-framework. The JMS’ onMessage-method contract states that any exception needs to be caught and must not escape into the framework. Otherwise JMS recognizes that the message delivery failed and reschedules the message.
Which in turn triggers the same exception, resulting in an indefinite loop of failed message handling. (Here a Stack Overflow answer that reiterates this point: https://stackoverflow.com/questions/2593628/what-happens-on-a-jms-queue-when-onmessage-throws-a-jmsexception/2595636)
This generates a fast growing wide tree that can, within minutes, send a backend out of memory.
Deep Trees
The other extreme of traces are deeply nested execution traces.
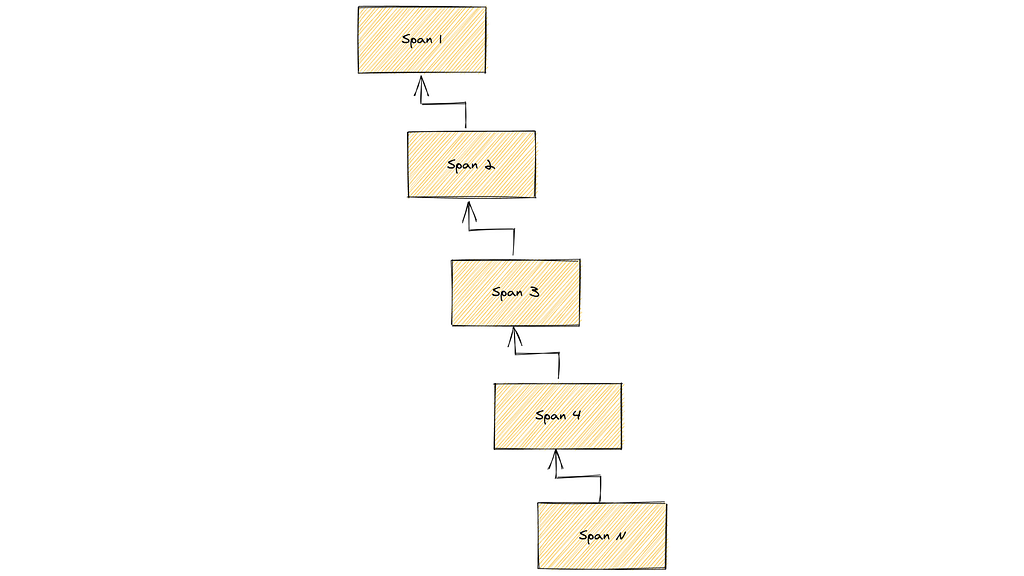 Deeply nested execution traces
Of course, for these execution traces there is the call stack limit within the observed application as first hard limit that could be reached. It needs to be tested whether a backend can handle such depth.
However, it is also possible to have an infinitely deep nested span chain without running into a call stack limit.
Queues are the perpetrator here. Imagine two message handlers and two queues: MessageHandler1 enqueues messages to be handled by MessageHandler2, which in turn again enqueues also a message, to be handled by MesssageHandler1, resulting in an infinite loop.
This example can be made arbitrarily complex, as long as there is a loop in the message handling processors.
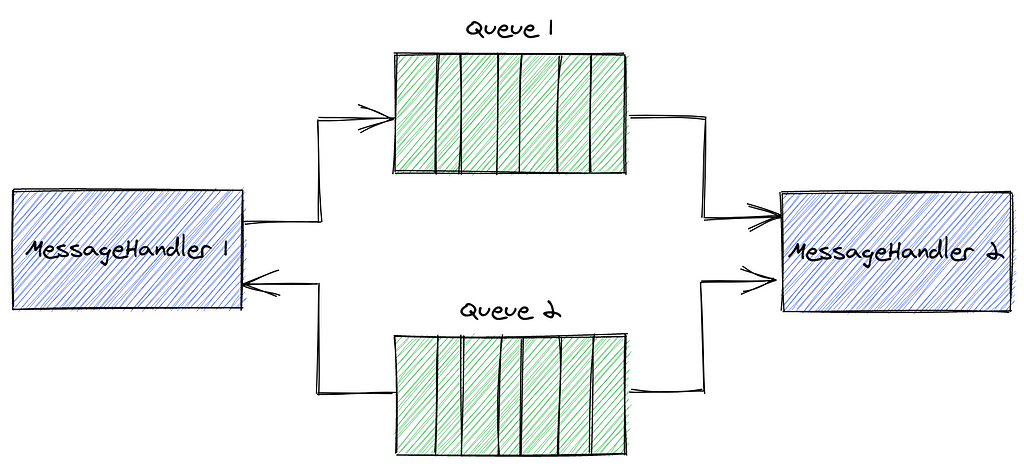 MessageHandler Circle
This can cause problems to both correlation on write and read. Indefinite growing traces cause at the very least memory problems.
Mitigation Strategies
Until now I have shown that traces can possibly grow indefinitely. But how do we deal with this issue at Dynatrace?
At first, as memory is a limited resource, we introduced limits for the width and the depths of trees, for both reading and writing. If the limit is reached the tree is cut off at that point.
There is no general limit that would fit all solutions. Therefore, this is something one needs to decide on a case-by-case basis. Since these are life-line limits, starting with a lower limit and increasing if necessary would be best. This limit should be configurable during runtime.
Cutting off a trace provides additional challenges. First, the position where the cut has occurred must be marked as such. Furthermore, for write correlation, what should be done with spans which still belong to the trace? In Dynatrace we mark these spans as “orphaned” to indicate that these would have belonged to some parent node.
The most important features that helped Dynatrace in dealing with these kinds of traces were:
- Temporarily disabling the source, allowing the backend to recover and thus ensuring normal operation until a fix is in place.
- Self-monitoring and problem notification, handled by Dynatrace itself, to be able to recognize these situations while they are still ongoing and collecting the necessary information for developers to analyze the situation.
Furthermore, there is also the question of a correlation algorithm. Over time Dynatrace experimented with a few algorithms. One conclusion is that recursion, while being simple, is unsuited to correlate traces.
Recursive correlation works as follows: start at a given span, search all child spans and add these to the trace. In a recursive call do the same for each of those childs.
Correlating deep traces eventually causes the backend itself to run into a stack trace limit. Several backends, e.g., Apache Skywalker, CNCF Jaeger, rely on recursion to correlate their traces.
On another note, would sampling have helped in these situations? To some degree, yes. However, most sampling methods sample on the root span of a tree, i.e., either the whole tree is rejected or not. The chances that one of these calls still reaches the backend is thus very high.
In conclusion
In this post, I’ve discussed correlation of traces, possible pitfalls and explained mitigation strategies deployed by Dynatrace.
One thing I hope I was able to convey is that these are situations anyone building a correlation for traces (be it OpenTelemetry or otherwise) needs to deal with. Unexpected use cases or errors that generate millions of spans can happen at any time.
Correlating distributed traces of large scale systems was originally published in Dynatrace Engineering on Medium, where people are continuing the conversation by highlighting and responding to this story.